Introduction
Vercara offers its customers a Distributed Denial-of-Services (DDoS) mitigation service, named UltraDDoS Protect. UltraDDoS Protect provides high-performance, flexible, and automated protection across 15 Points of Presence (PoPs) and >15Tbps of DDoS mitigation capacity to enable customer availability and performance under even the largest and most complex DDoS attacks. You can find out more information about UltraDDoS Protect on its product page at https://vercara.digicert.com/ddos-protection. Additionally, Vercara uses UltraDDoS Protect to defend its UltraDNS, UltraDNS2, UltraDDR, and UltraWAF platforms against DDoS attacks.
This report is a summary of Distributed Denial-of-Services (DDoS) attacks detected and mitigated by UltraDDoS Protect for the month of March 2024. It is a recurring report highlighting monthly trends observed by our platform and analysts. This report is released as TLP: CLEAR except where noted.
Overall themes in DDoS attack traffic:
- Smaller DDoS attacks of less than 1Gbps are incredibly common, increasing in quantity, and very effective if targeted against vulnerable assets or services.
- Mega-attacks larger than 100 Gbps are statistically rare but require that you defend against them with a service provider that has adequate capacity.
- Some attacks have a lower amount of bandwidth but millions of Packets-per-second (Mpps) that cause routers and firewalls to crash instead of filling circuits like high-Gbps attacks.
- Multi-vector DDoS attacks use different simultaneous attack techniques to make it harder to analyze their traffic and easier to evade DDoS mitigation.
- Attackers are using “carpet bombing” attacks launching near-simultaneous series of small-duration attacks against many IP addresses in a network block to evade sampling and blocking of individual attack vectors and to subvert per destination rate-limit-based thresholds.
Stats at a Glance
Total Number of Attacks: 6311
Number of Mega Attacks (100+ Gbps): 96 (1.53% of all observed attacks) (6.67% increase from February 2024)
Largest DDoS Attack (Gbps): 939.43 Gbps
Largest DDoS Attack (million packets-per-second): 314.41 Mpps
Longest DDoS Attack: 3.67 Days
Average DDoS Attack (Gbps): 7.01 Gbps
Average DDoS Attack (packets-per-second): 1.52 Mpps
Average Duration: 27.68 minutes
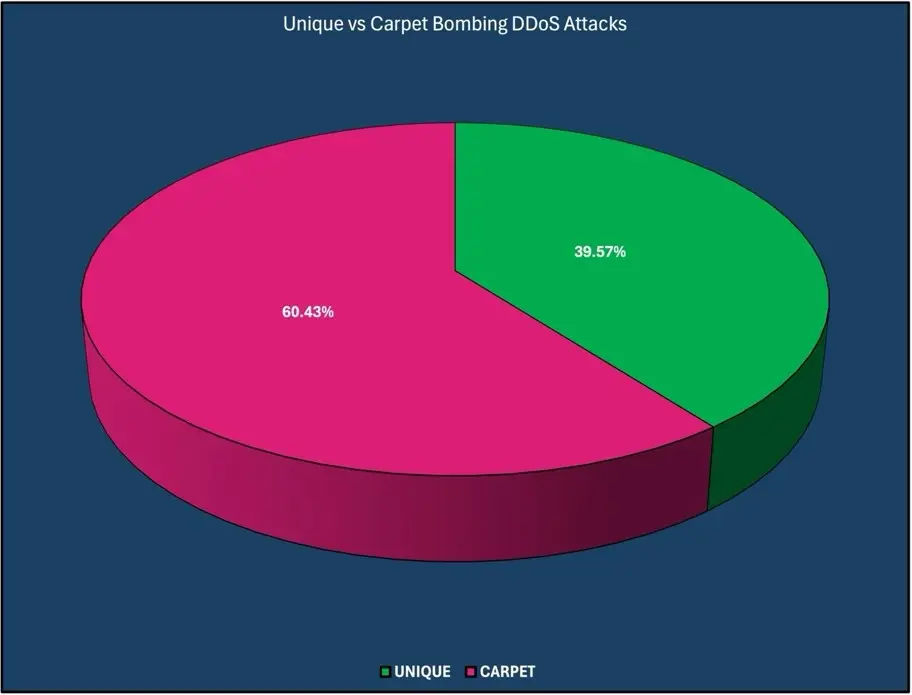
Unique vs Carpet Bombing: 39.57% Unique / 60.43% Carpet Bombing
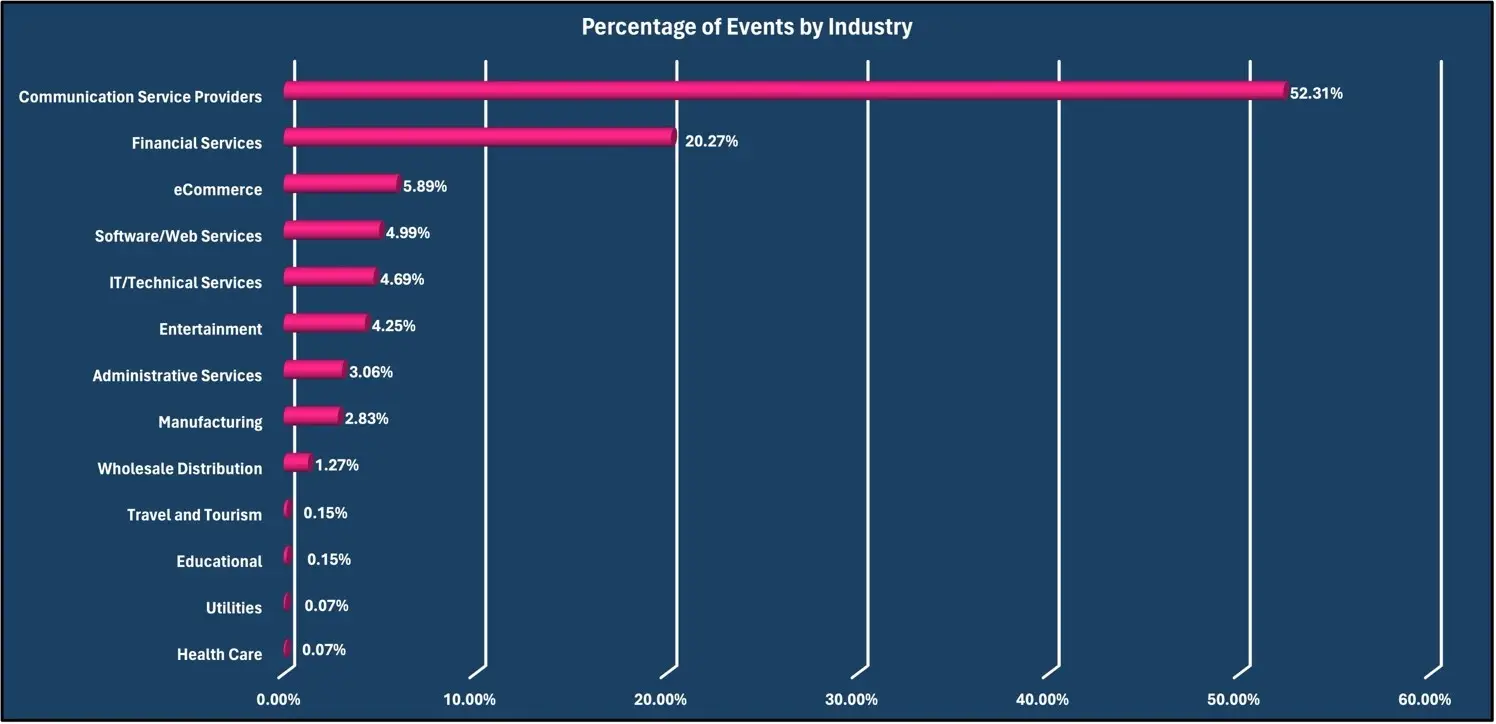
Top Three Industry Targeted: Communication Service Providers (52.31), Financial Services (20.27%), eCommerce (5.89%, a 12.86% increase from February 2024)
Attack Statistics and Trends
DDoS attacks are more common than Information Technology and Information Security Teams realize. Most attacks are mitigated quickly. The month-over-month number of DDoS attacks varies based on a wide variety of factors such as exploit development, hacktivist campaigns, number of infected systems used in an attack, and law enforcement takedown operations.
March 2024 saw 6311 DDoS attacks detected by the Vercara UltraDDoS Protect platform, a 20.18% decrease from February 2024.
DDoS attacks can be measured in terms of the maximum rate of gigabits per second (Gbps) observed during the attack. Gbps typically flood the network circuits going to the target, causing them to reject additional traffic.
The largest DDoS attack observed during March 2024 consisted of over 939.43 Gigabits per Second (Gbps) with over 283 million packets per second (Mpps). Most of the observed DDoS attacks were between 0 Gbps and 0.5 Gbps, with 2933 (46.63%) of all observed attacks. Attacks between 0.5-1 Gbps in size were second in frequency with 1454 (23.12%), and attacks between 1-5 Gbps in size were third with 901 (14.32%) of observed attacks.
DDoS attacks can also be measured in packets per second (PPS). High-PPS attacks flood out network devices such as routers, firewalls, and switches as they track sessions.
The largest packet attack observed consisted of over 314.40 million packets per second. The most frequent number of attacks was between 100-150K and 40-50K packets per second.
Gigabit-per-second |
| Packets-per-second (PPS) | |||||||
Gbps | Total Count | % |
| PPS | Total Count | % | PPS | Total Count | % |
0-0.5 | 2933 | 46.63% |
| 0-10K | 717 | 11.40% | 150-200K | 279 | 4.44% |
0.5-1 | 1454 | 23.12% |
| 10-20K | 491 | 7.81% | 200-250K | 203 | 3.23% |
1-5 | 901 | 14.32% |
| 20-30K | 291 | 4.63% | 250-300K | 107 | 1.70% |
5-10 | 285 | 4.53% |
| 30-40K | 488 | 7.76% | 300-400K | 139 | 2.21% |
10-50 | 480 | 7.63% |
| 40-50K | 692 | 11.00% | 400-500K | 163 | 2.59% |
50-100 | 141 | 2.24% |
| 50-60K | 620 | 9.86% | 500K-1M | 513 | 8.16% |
100+ | 96 | 1.53% |
| 60-70K | 200 | 3.18% | 1-2M | 249 | 3.96% |
|
|
|
| 70-80K | 127 | 2.02% | 2-3M | 103 | 1.64% |
|
|
|
| 80-90K | 99 | 1.57% | 3-5M | 146 | 2.32% |
|
|
|
| 90-100K | 99 | 1.57% | 5-10M | 193 | 3.07% |
|
|
|
| 100-150K | 207 | 3.29% | 10+M | 164 | 2.61% |
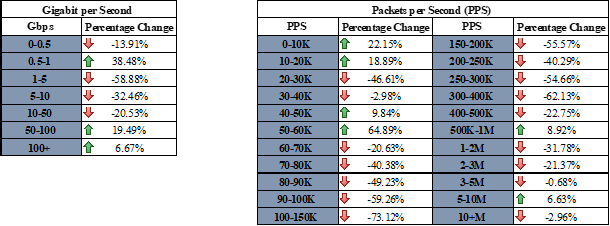
The chart below shows the percentage of change in both gigabit-per-second and packet-per-second observed from February 2024 to March 2024. The largest increase in attacks was between 0.5 and 1 Gbps, with an increase of 38.48% compared to the prior month. Mega attacks of over 100 Gbps continue to rise and had an increase of 6.67% in March compared to February. Regarding packets-per-second (pps) the largest change was that attacks were observed consisting of 50-60K pps with an increase of 64.89%.
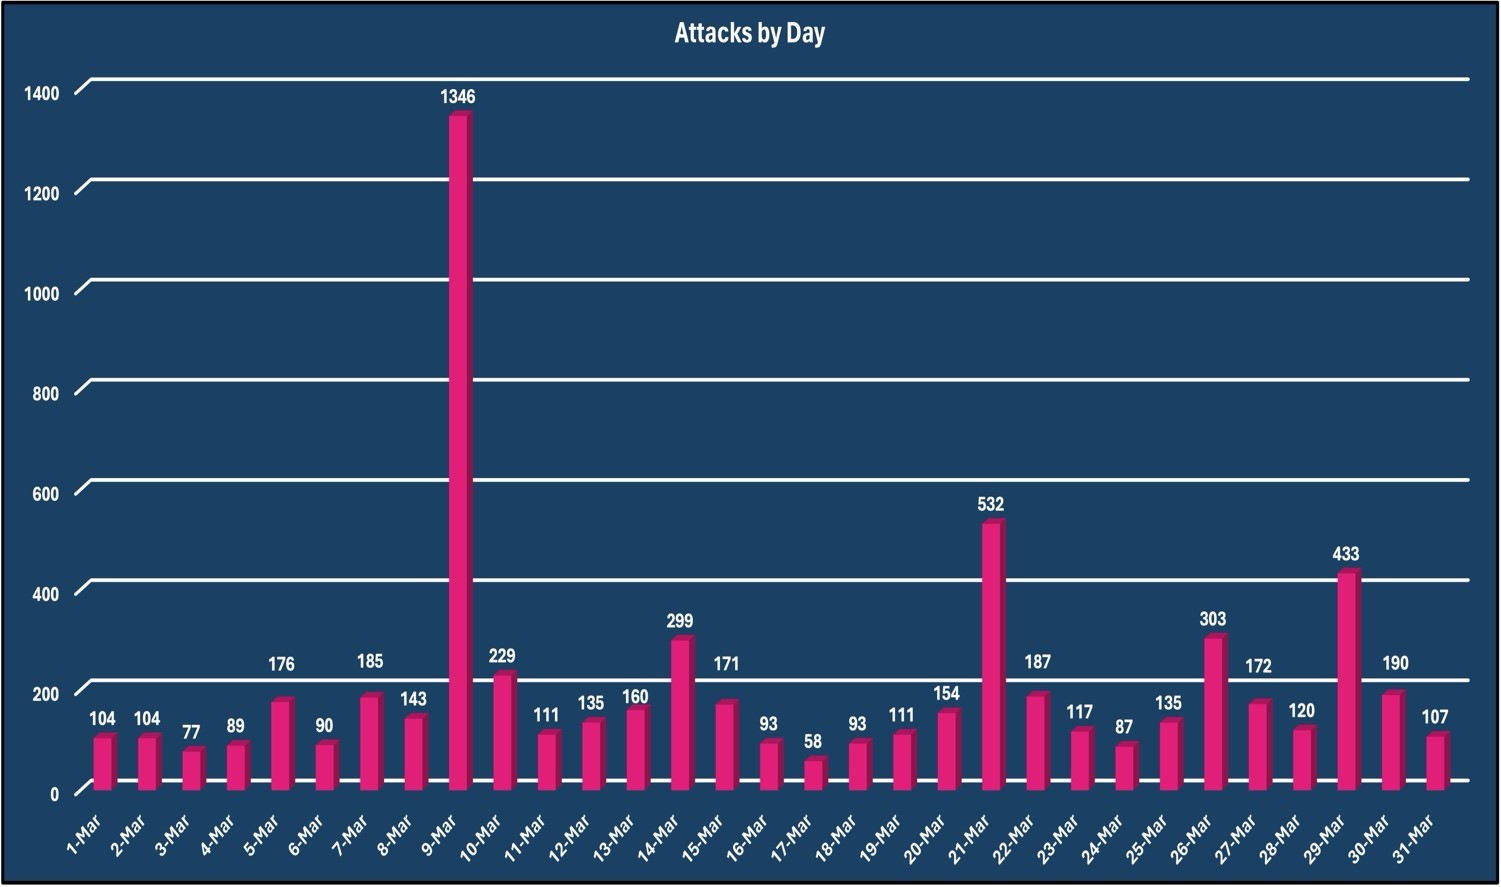
On March 9th, there were 1346 DDoS attacks observed, an 813.29% increase from the daily average. These attacks were primary against a Communication Service provider and Vercara was able to mitigate all observed DDoS attacks with no degradation to not only to the targeted customer but to any other Vercara customer.
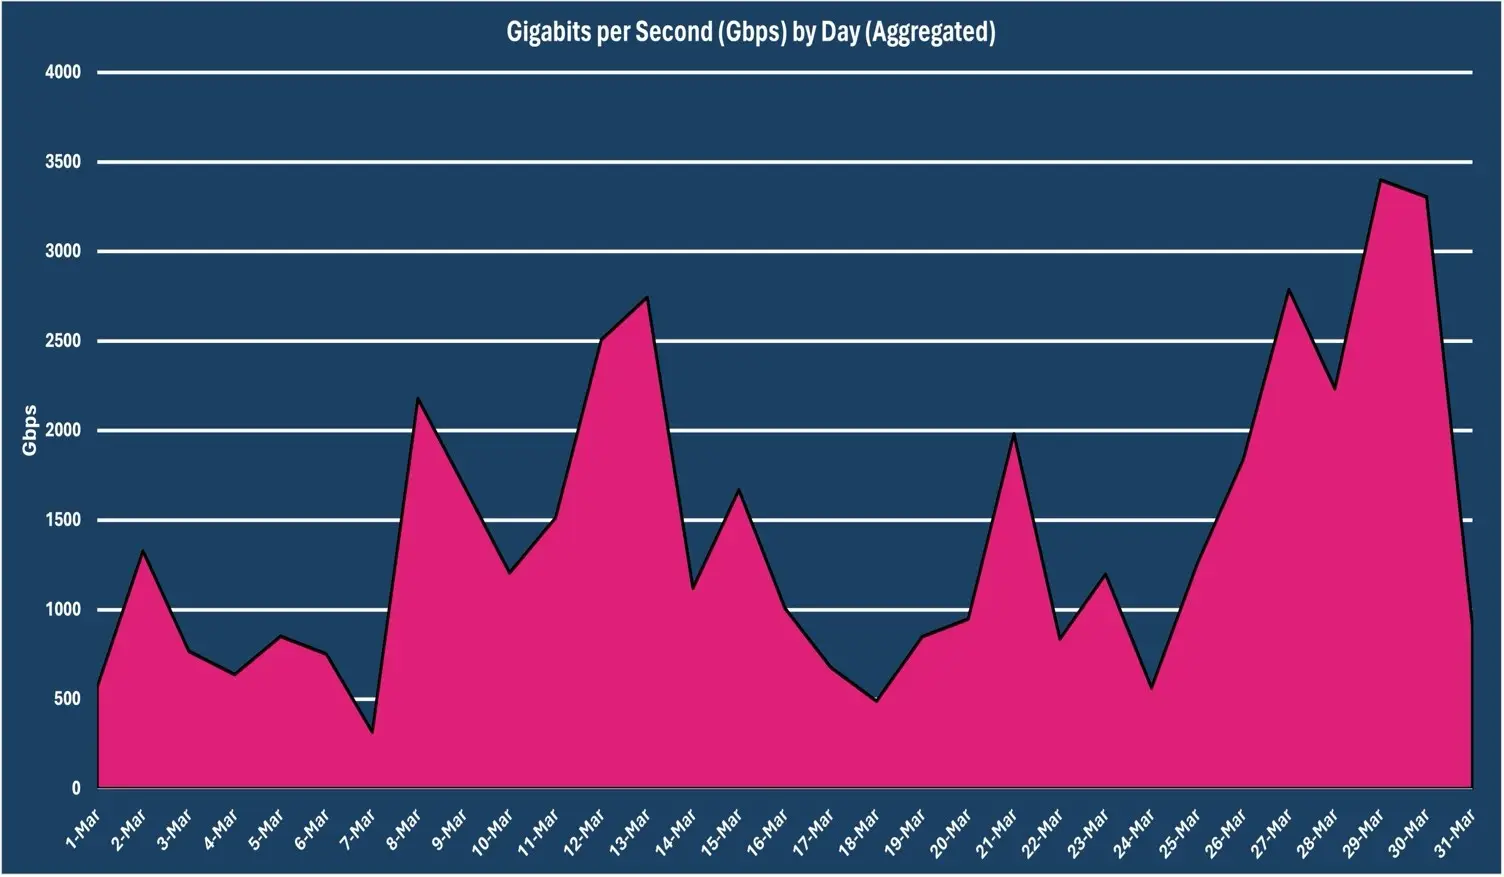
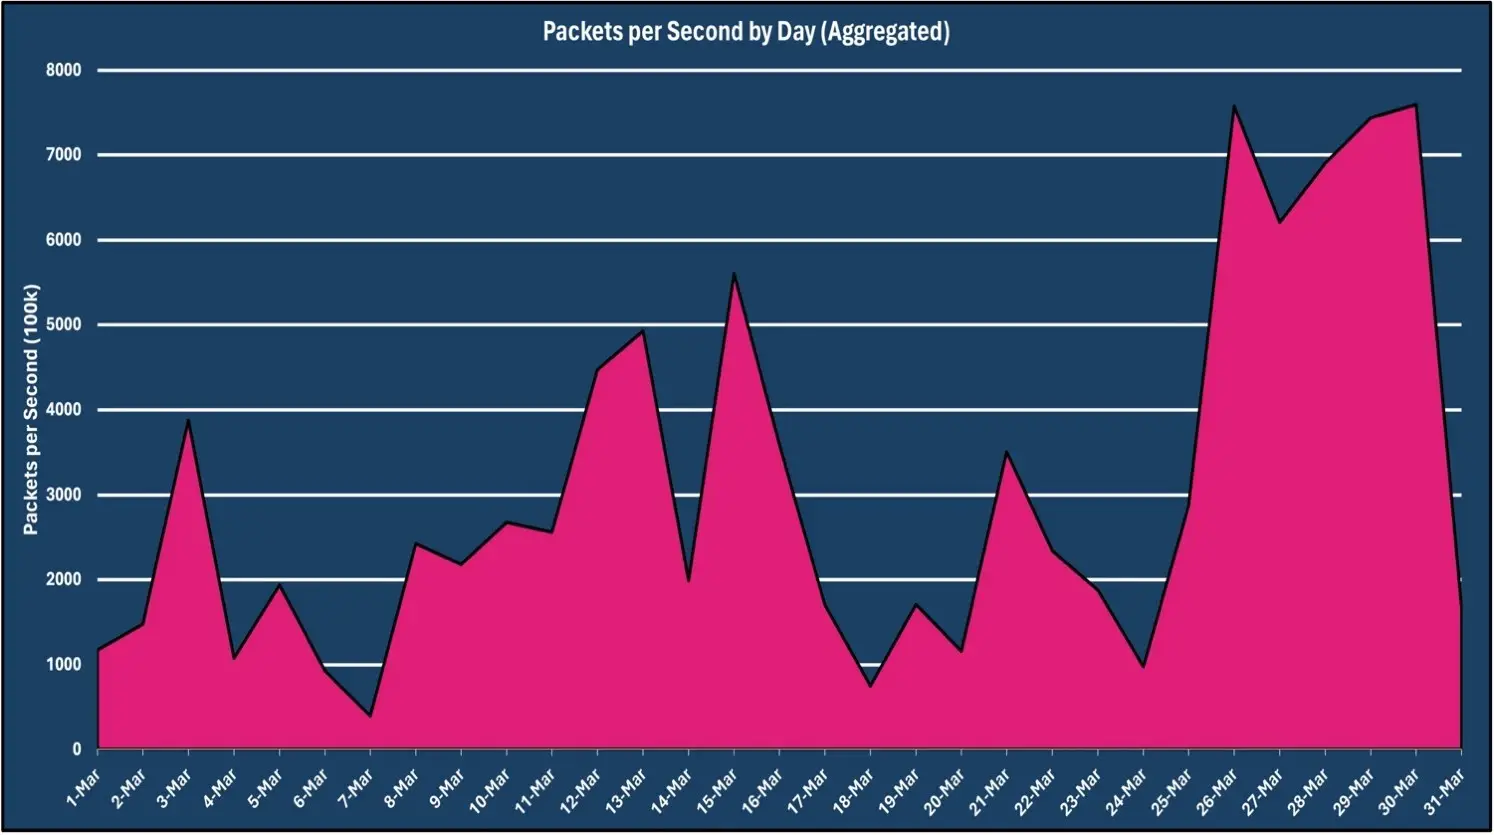
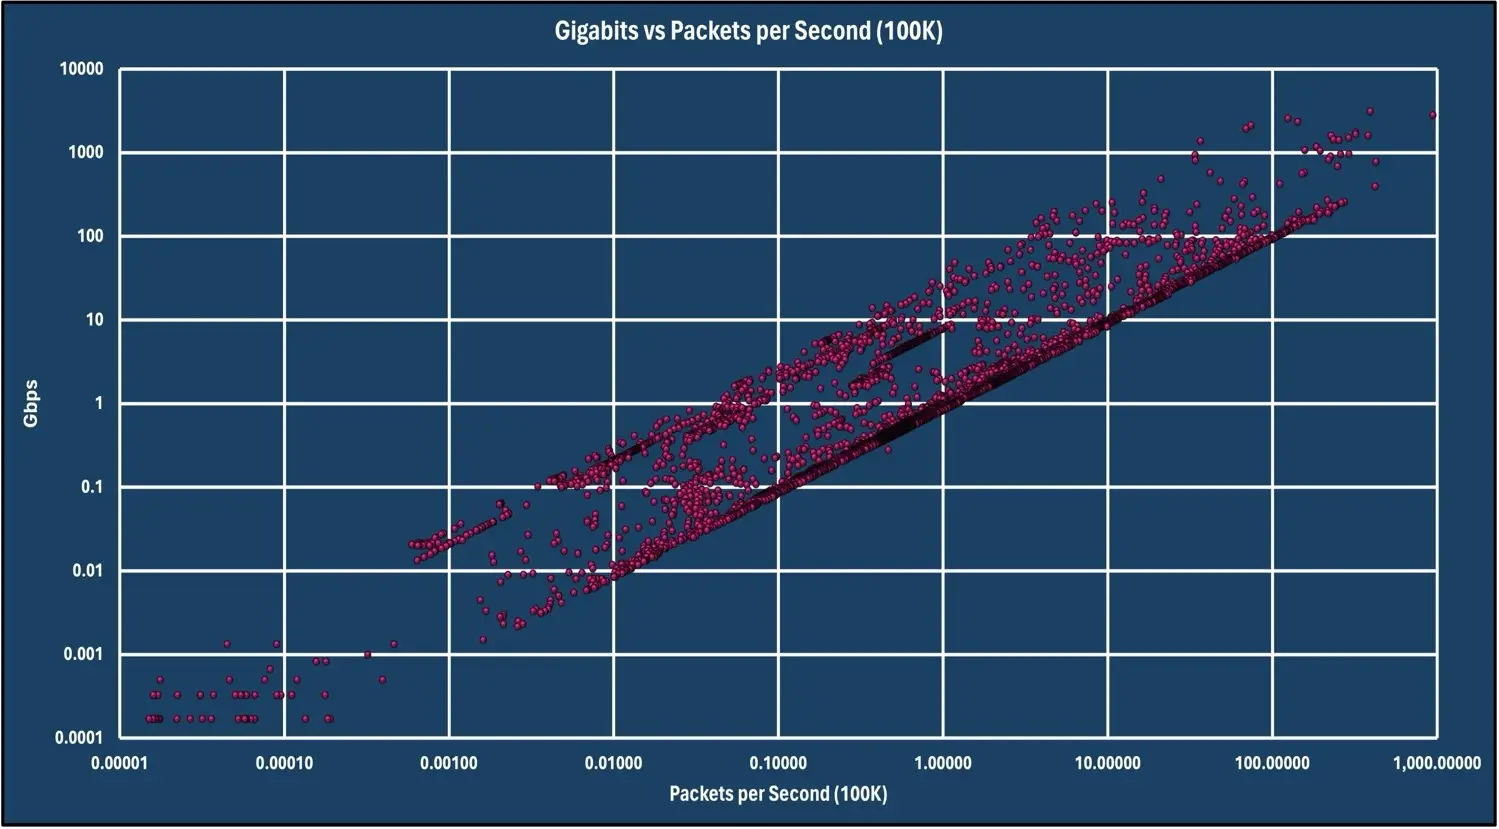
The chart below shows the correlation between Gbps and pps observed during March 2024.
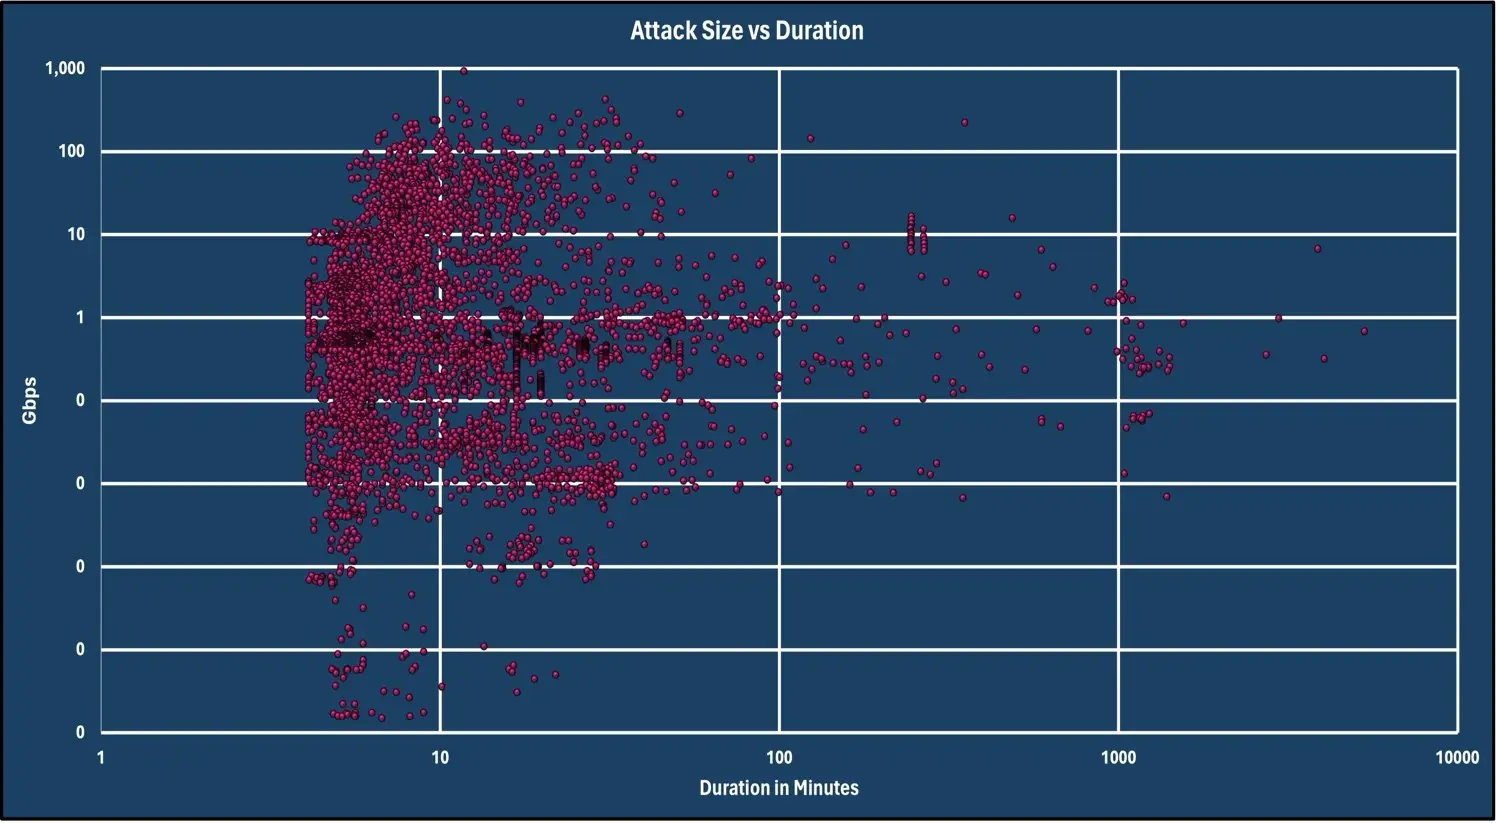
The chart below shows the correlation between Gbps and the duration of DDoS attacks observed during March 2024.
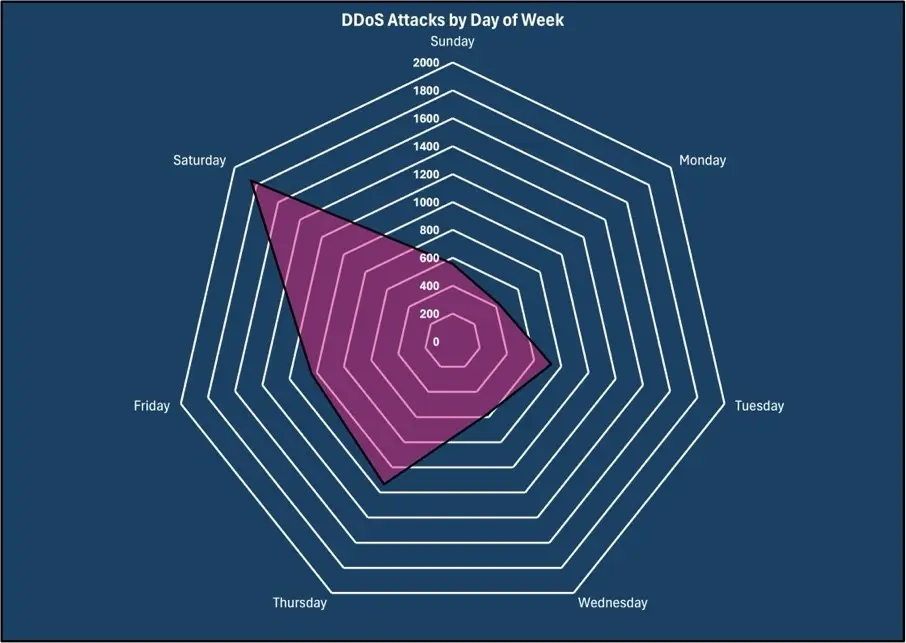
DDoS Attacks by Day of the Week and by Hour
DDoS attacks are timed to be an annoyance to security operations teams who are called in to help with the mitigation. Having to “page out” to on-call staff also means a delayed response in mitigation, increased possibility of human error in making infrastructure changes, and a longer outage or service degradation to the target.
For the month of March 2024, Saturday was the most prolific day for DDoS attacks, with 29.31% of all DDoS attacks occurring on that day. Thursday was the second day of the week with the most DDoS attacks with 18.00%, and Friday was third with 16.45%.
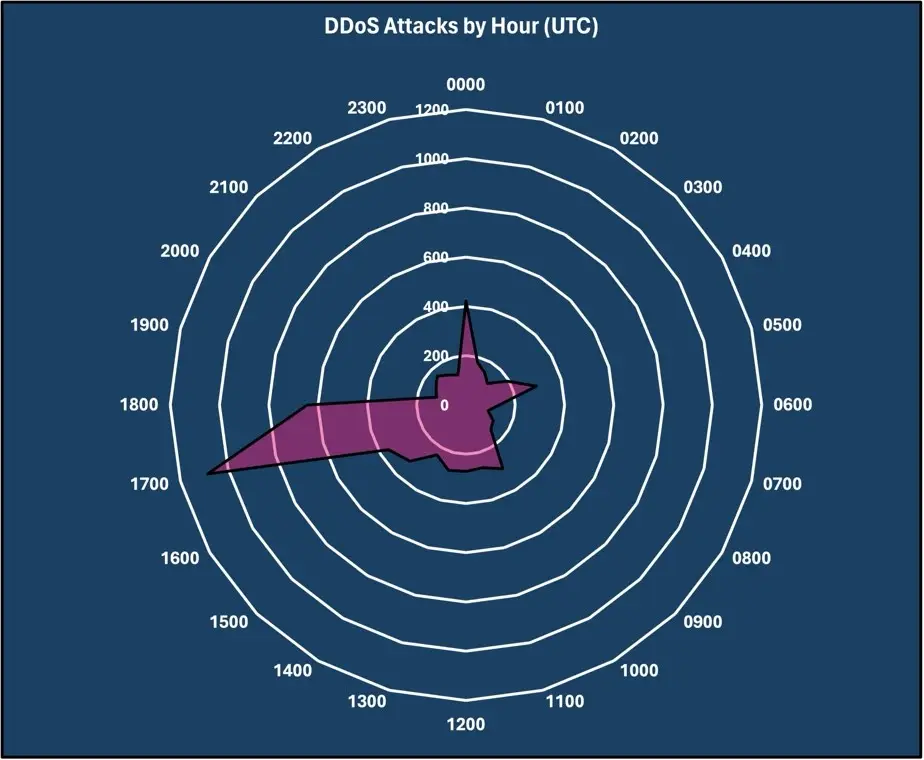
For March 2024, the time between 1700-1800UTC saw the most DDoS attacks with 17.19%. The time between 1800-1900UTC was second with 10.20% and the time between 0000-0100UTC with 6.69%.
Unique vs carpet bombing DDoS attacks.
Carpet bombing DDoS attacks target all the IP addresses in an Autonomous System or network block over a brief period to evade detection and blocking but also to overload some types of mitigation gear with clean traffic by forcing the target organization to onboard all their network blocks.
For March 2024, carpet bombing DDoS attacks accounted 60.43% of all observed attacks. Carpet bombing DDoS attacks continue to rise month over month, and it is assessed that this trend will continue throughout 2024.
Below are some notable Carpet-Bombing attacks observed during March 2024.
Date | DDoS Attacks | Duration |
March 5th | 84 | 4 Hours and 58 Minutes |
March 7th | 96 | 6 minutes |
March 9th | 1250 | 3 Hours and 6 Minutes |
March 10th | 115 | 5 Hours and 38 Minutes |
March 14th | 46 | 3 Hours and 40 Minutes |
March 14th | 128 | 5 Hours and 8 Minutes |
March 15th | 95 | 4 Hours and 40 Minutes |
March 21st | 67 | 1 Hour and 28 Minutes |
March 21st | 362 | 4 Hours and 37 Minutes |
March 26th | 151 | 51 Minutes |
March 29th | 256 | 6 Minutes |
March 29th | 60 | 3 Hours and 9 Minutes |
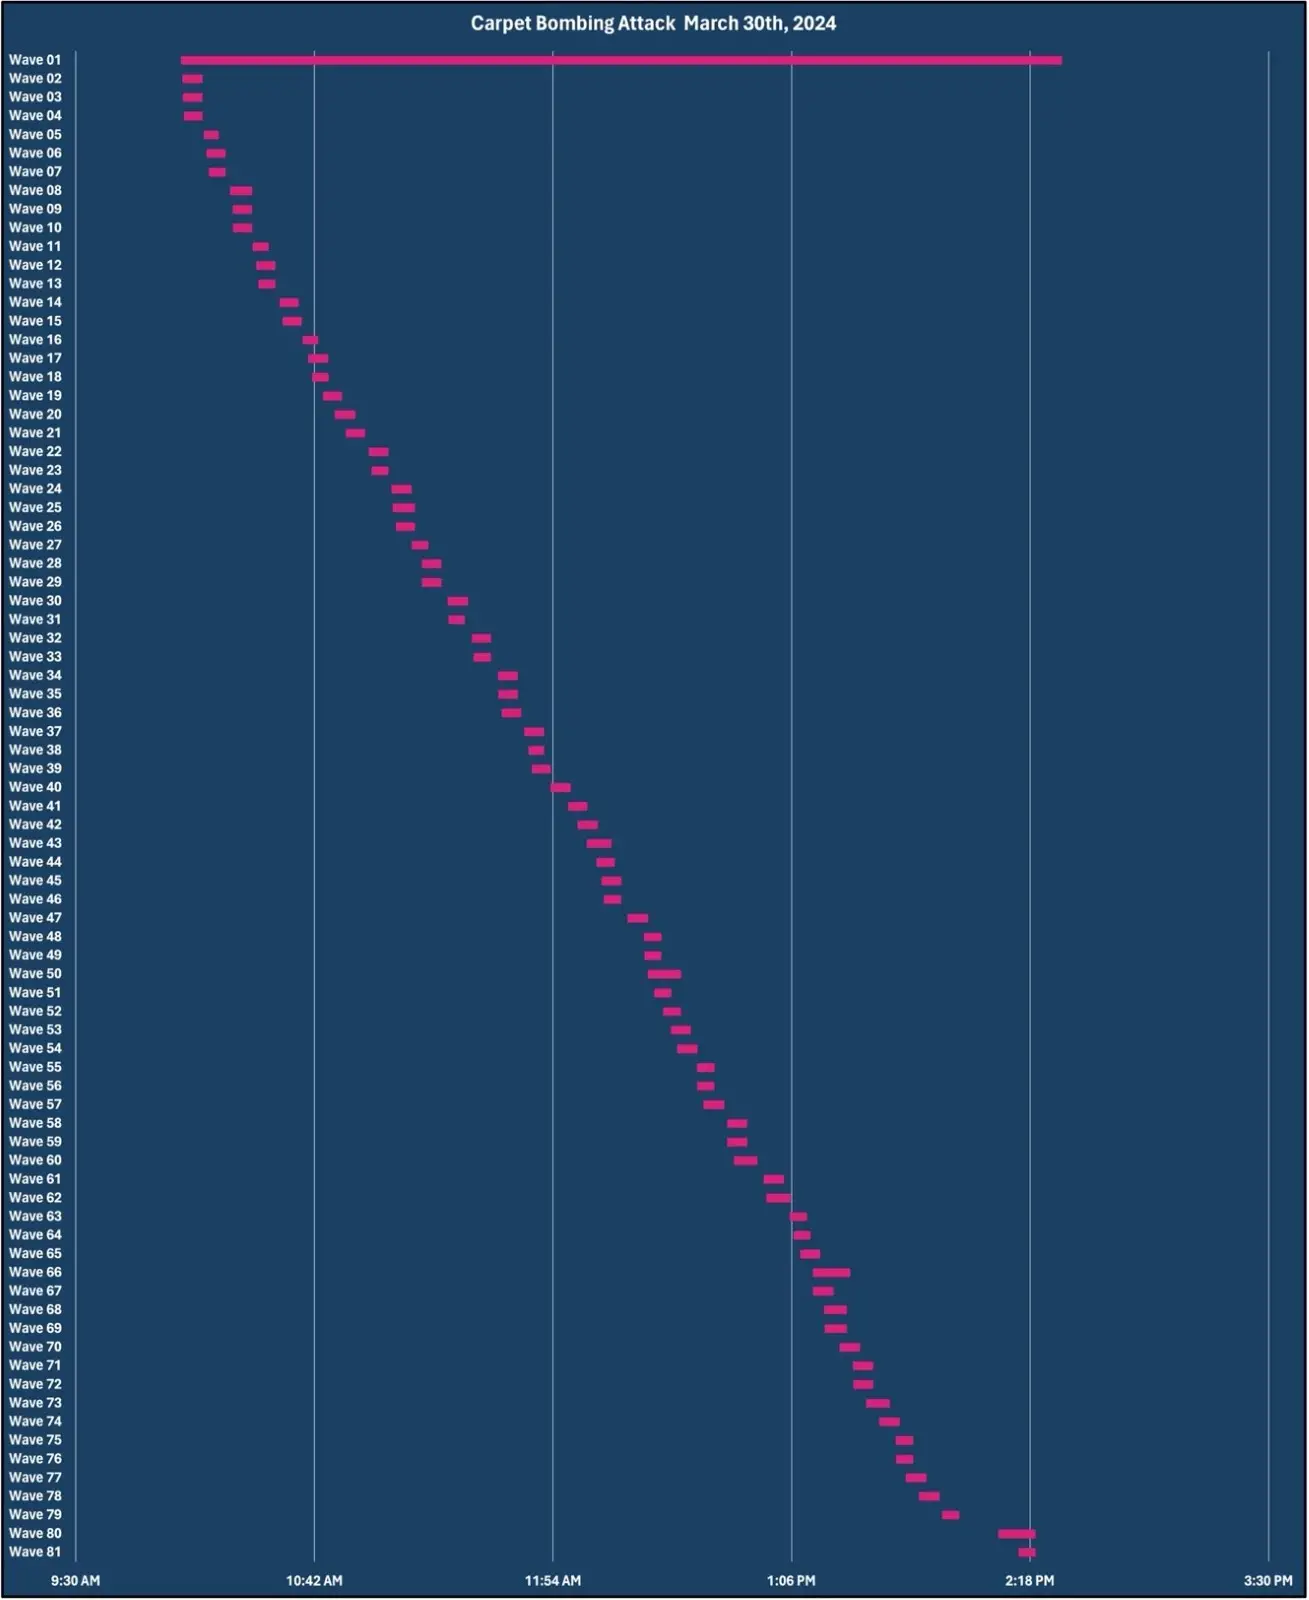
March 30th | 81 | 4 Hours and 18 Minutes |
Below is the visual representation of a carpet-bombing attack that occurred on March 30th, 2024. This carpet-bombing attack consisted of 81 different DDoS waves that averaged between four and six minutes with the longest attack lasting approximately four hours and twenty-five minutes.
 Attack Vectors
An attack vector is a mechanism, usually an abused network protocol or a variety of packets inside it, that a DDoS attack uses to generate high volumes of traffic. Attack vectors also serve as signatures to detect DDoS traffic outside of looking solely at Gbps and PPS. Attack vector statistics change in popularity from month to month based on attack platform tooling, numbers of vulnerable endpoints that are accessible across the internet, and newly discovered vulnerabilities.
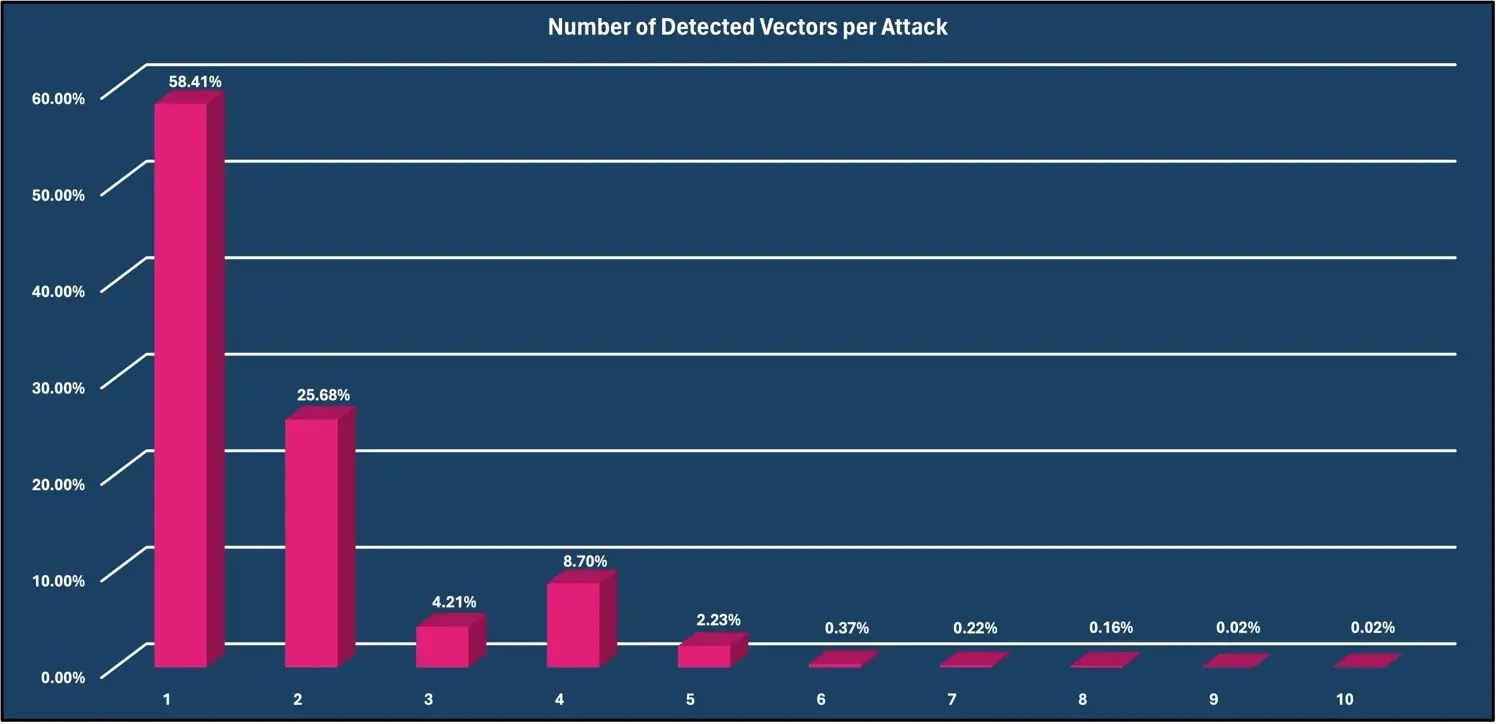
For March 2024, the most prevalent attack vector observed was the IP Fragmentation vector with 20.93% of all attacks utilizing this method. The DNS Amplification vector was second with 19.85%. UDP vector was third with 15.08%. Additionally, 58.41% of DDoS attacks consisted of only one attack vector and 41.59% of DDoS attacks consisted of two or more vectors per attack.

Events by Targeted Industry
The industry targeted in an attack is of interest because it can be extrapolated into other organizations inside of that industry as a “peer benchmark.” Industry statistics also provide insight into DDoS attack campaigns. For instance, attacks against eCommerce companies usually are related to protection racket and DDoS ransom activity, while attacks against government is usually geopolitical or hacktivism.
The most prevalent target for malicious traffic was against the Communication Services Providers industry with 52.31% of observed attacks. CSP attacks entail a high level of collateral damage to downstream customers. The Financial Services industry was second with 20.27%. The eCommerce industry was third with 5.89% of observed malicious traffic, this is the first month that the eCommerce industry was in the top three targeted industries.
 Attacks by Source Country
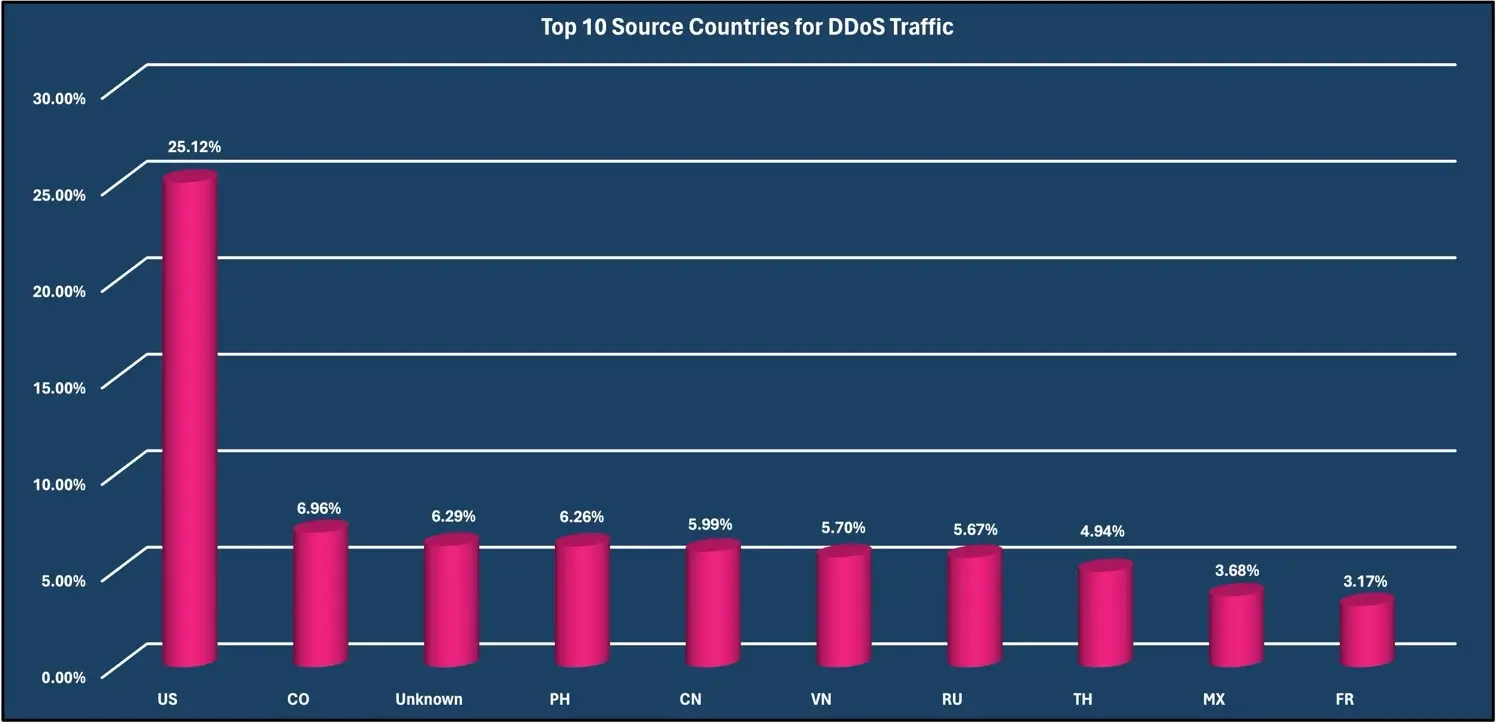
During this reporting period, the United States was observed to have the most originating DDoS traffic with 25.12%; this is due to malicious actors using the United States-based botnets as well as Virtual Private Servers (VPS) located in the United States to hide their true locations. US-based cloud services and botnets comprised of many compromised IoT devices provide easy access to high-quality bandwidth that is very attractive for bad actors to leverage. Colombia was second in this reporting period, with 6.96% of DDoS traffic observed. 6.29% of all DDoS traffic was classified as “Unknown” due to being unable to identify the source location of the DDoS traffic. It is important to note that DDoS source IPs can be spoofed (depending on the attack vector and tool), so the true source origin of all the attack traffic may vary. High numbers of compromised IoT devices, access to very high bandwidth VPS on major cloud providers, and concentration of spoof-able allocated IP blocks may contribute to the source country distribution.
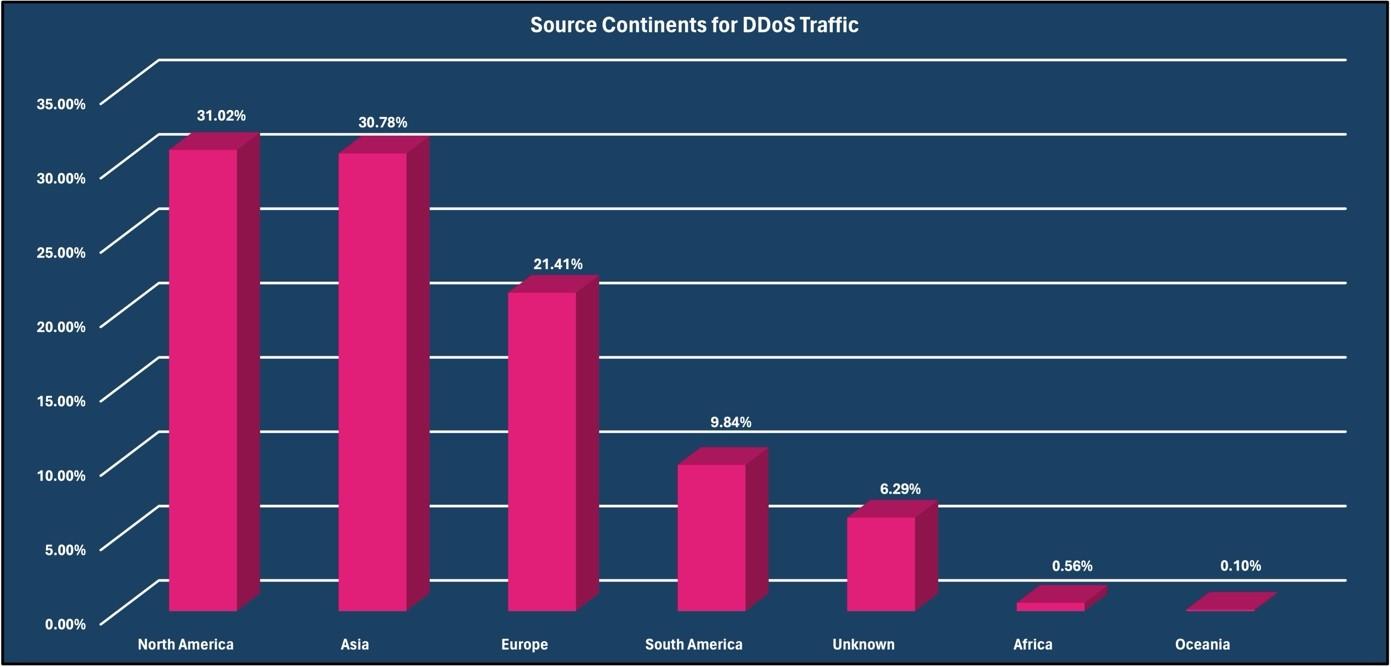
The North American continent accounted for 31.02% of all observed DDoS attacks. The Asian continent was second with 30.78%, and the European continent was third with 21.41%.
This document is released as TLP: CLEAR. Traffic Light Protocol definitions and usage is maintained by the Forum of Incident Response and Security Teams at https://www.first.org/tlp/.


