Many organizations today have a material dependency on the availability and performance of their Internet-facing websites, Application Programming Interfaces (APIs), and other services. This requires a reliable digital infrastructure so they can maintain continued revenue, service delivery, sales leads, reduce costs, and maintain other business operations. From customer experience to employee productivity, the daily activities across internet-first organizations need stable, low-latency, and resilient network connectivity and application reliability. To ensure continued uptime, companies need to monitor their Domain Name System (DNS), website, API, and infrastructure service availability and performance and to respond quickly to interruptions.
Increasingly, attackers target the DNS infrastructure because they know that the service outages lead to business interruption costs, giving victims an incentive to pay ransoms. For security teams, Distributed Denial of Service (DDoS) attacks are often more difficult to mitigate and investigate. With current threat intelligence from experts who understand the Tactics, Techniques, and Procedures (TTPs) that threat actors use to evade detection, security teams are more prepared to combat these activities and mitigate risks, like carpet-bombing attacks.
Every month, Vercara reports on trends across three critical infrastructure domains:
- Distributed Denial of Service (DDoS) attacks
- Domain Name Service (DNS) traffic
- Web Application Firewall (WAF) attacks
This monthly roundup of reports provides information to help defenders manage their infrastructure, applications, and cloud-based security solutions.
DDoS: Decrease in Numbers with Increase in Size
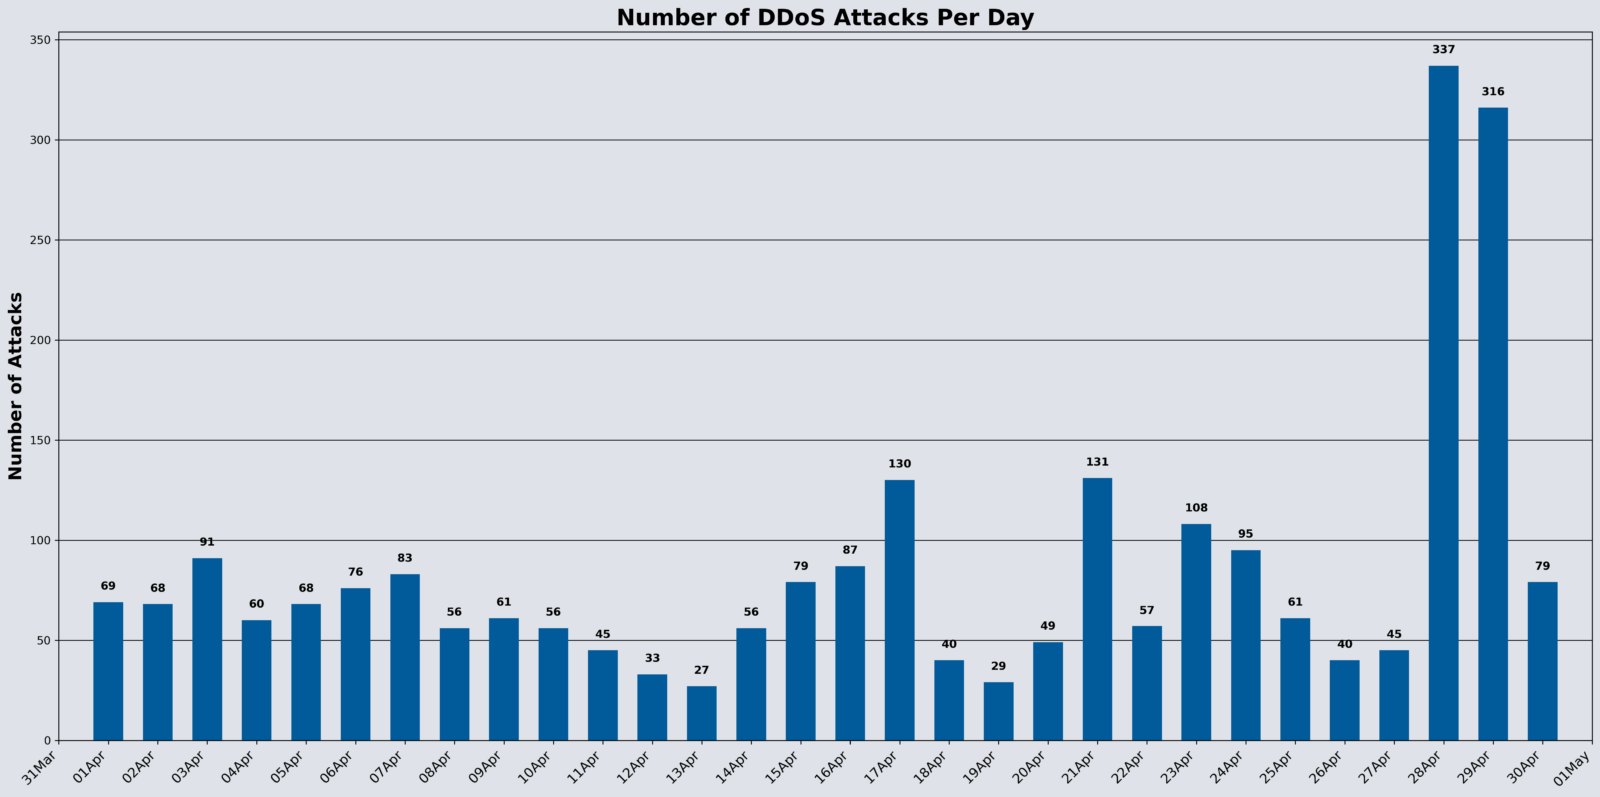
Overall, DDoS attacks saw a 49.39% month-over-month decrease in volume that likely relates to attackers reconstituting their infrastructure after law enforcement take downs of their infrastructures and focusing on targeted, meaningful DDoS attacks rather than broad, indiscriminate campaigns.
Of the data gathered, the following highlights offer insights:
- 2,532 DDoS attacks detected, with Vercara’s monitoring and mitigation preventing approximately 1,293 hours of downtime, a 26.93% increase compared to March.
- Average attack size surged by 84.89%, and the average duration increased by 150.82% to 30.65 minutes.
- Largest observed attack consisted of over 216.37 Gigabits per Second (Gbps) with
- over 20 million packets per second (Mpps).
- 50% decrease in mega attacks (100+ Gbps).
For more details, check out the DDoS Analysis report, which is published monthly.
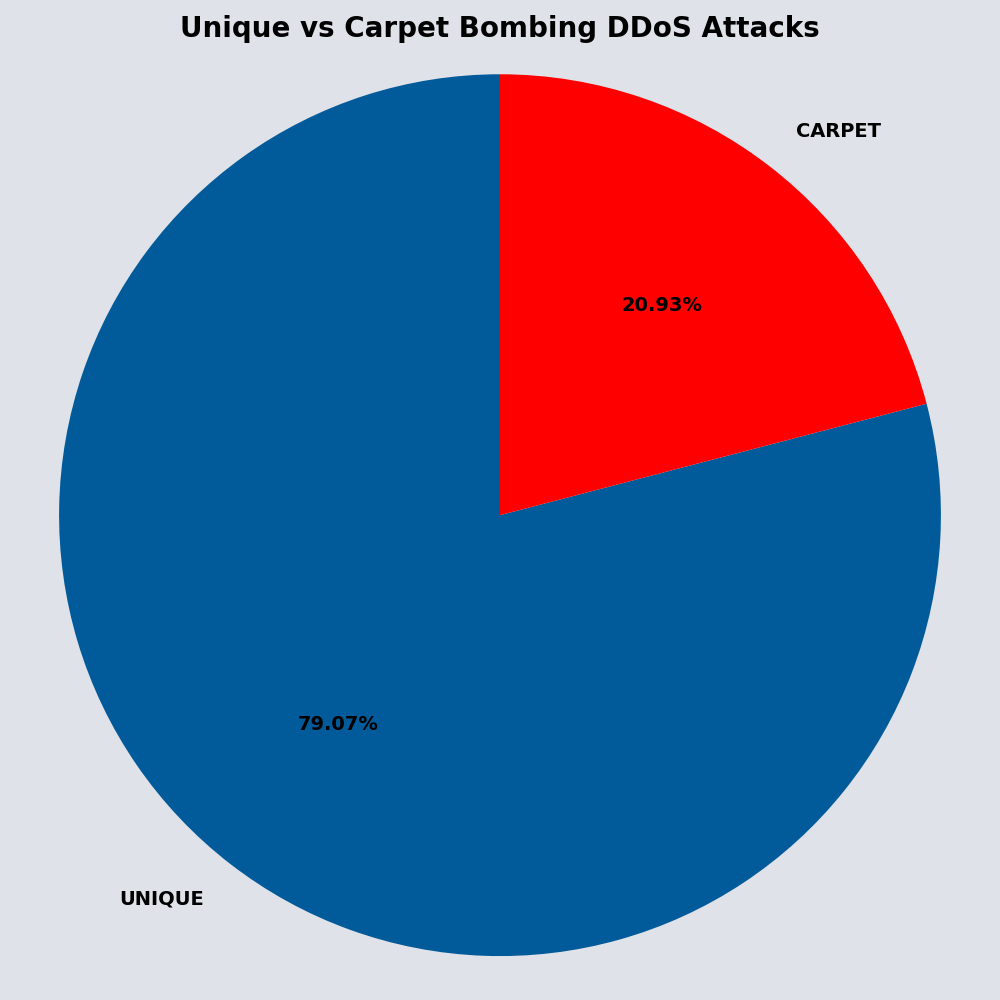
Carpet Bombing Stays Steady
Small attacks between 0-0.5 GBPS accounted for 2,014, or 79.76% of all observed attacks.
Comparing month-to-month changes notes the following:
- Small attacks (0-0.5 Gbps): -49.80%
- Mega Attacks (100+ Gbps): -50.00%
When malicious actors target numerous IP addresses with smaller-sized attacks, called carpet bombing, they intend to evade detection and make mitigation more difficult. Carpet bombing attacks account for 20.93% of the April DDoS attacks observed.
Since most organizations typically set alert triggers at higher gigabit levels, carpet bombing DDoS attacks create mitigation challenges because the threat actors:
- Remain under alerting thresholds
- Flood networks
- Rotate target IPs and destinations
- Rotate targeting method
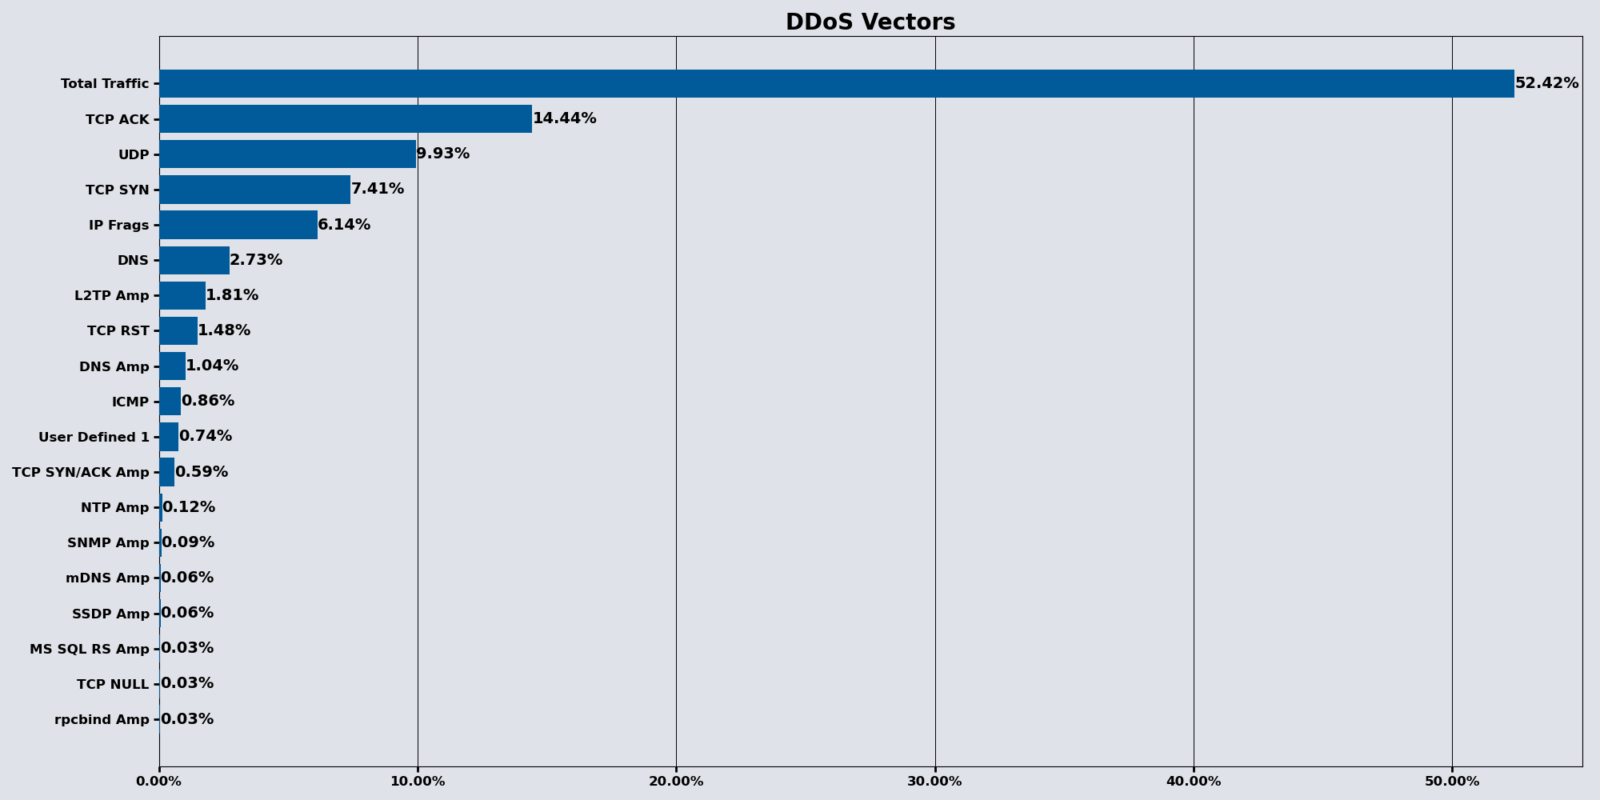
Top 3 Attack Vectors
The Total Traffic vector maintained the number one spot. While TCP ACK floods target the way servers manage connections. By sending a massive number of spoofed ACK packets, they force the server to expend resources searching for non-existent connections, eventually exhausting its capacity to handle legitimate traffic.
The top three attack vectors for April were:
- Total Traffic: 52.42% (compared to March’s 45.13%)
- TCP ACK: 14.40% (compared to March’s 30.26%)
- UDP: 9.93% (compared to March’s 11.86%)
75.99% of observed DDoS attacks consisted of one DDoS vector while 24.01% consisted of two or more.
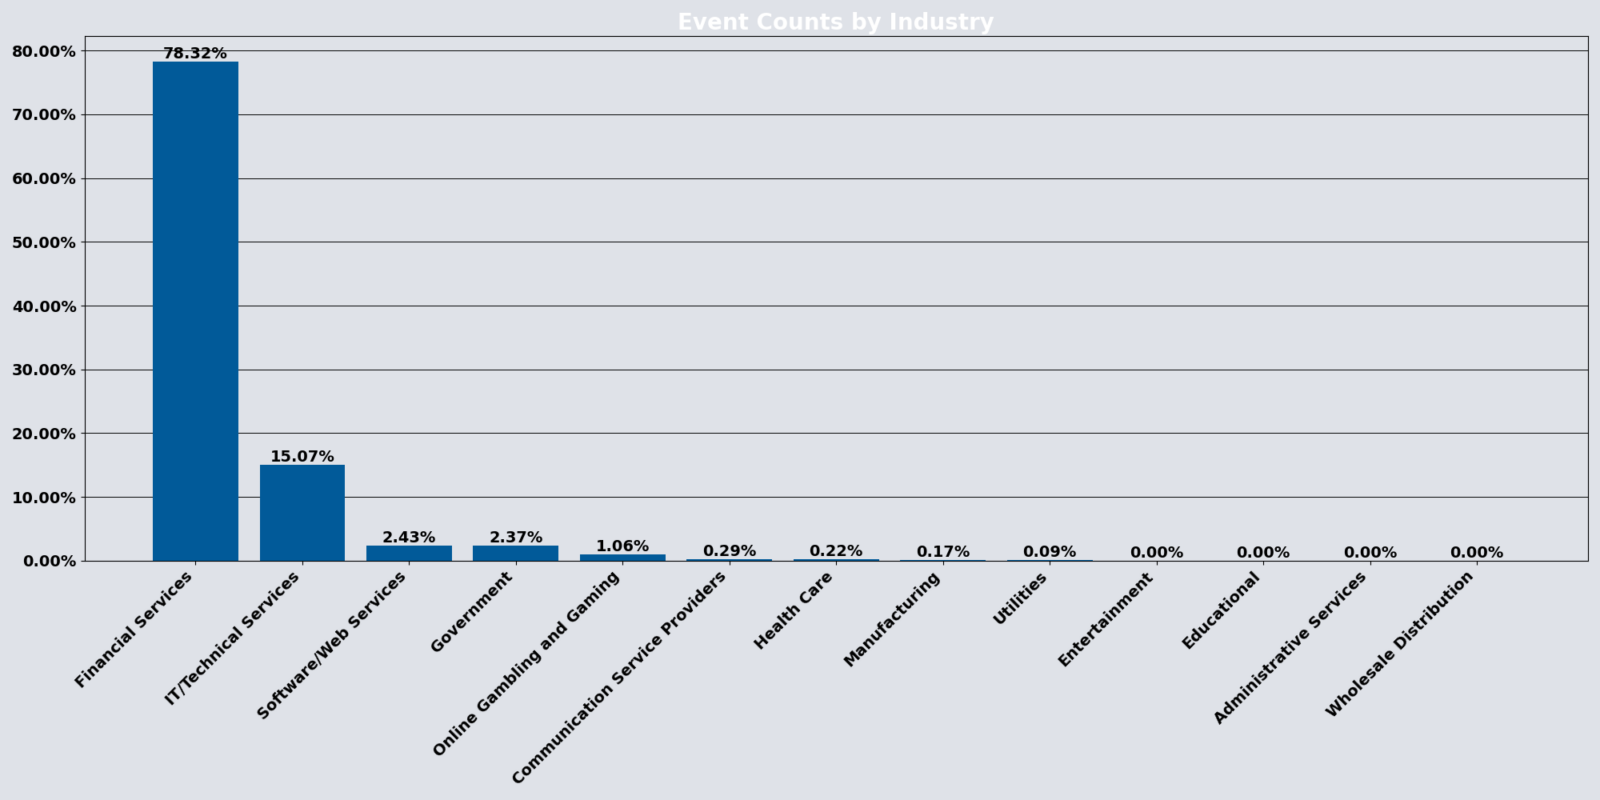
Top 3 Industries
The Financial Services industry was the most targeted during the month of April, along with the following two industries by percentage of events listed as:
- Financial Services: 78.32%(compared to March’s 59.71%)
- IT/Technical Services: 15.07% (compared to March’s 38.29%)
- Software/Web Services: 2.43%
DNS: Steady Activity and Increasing Security
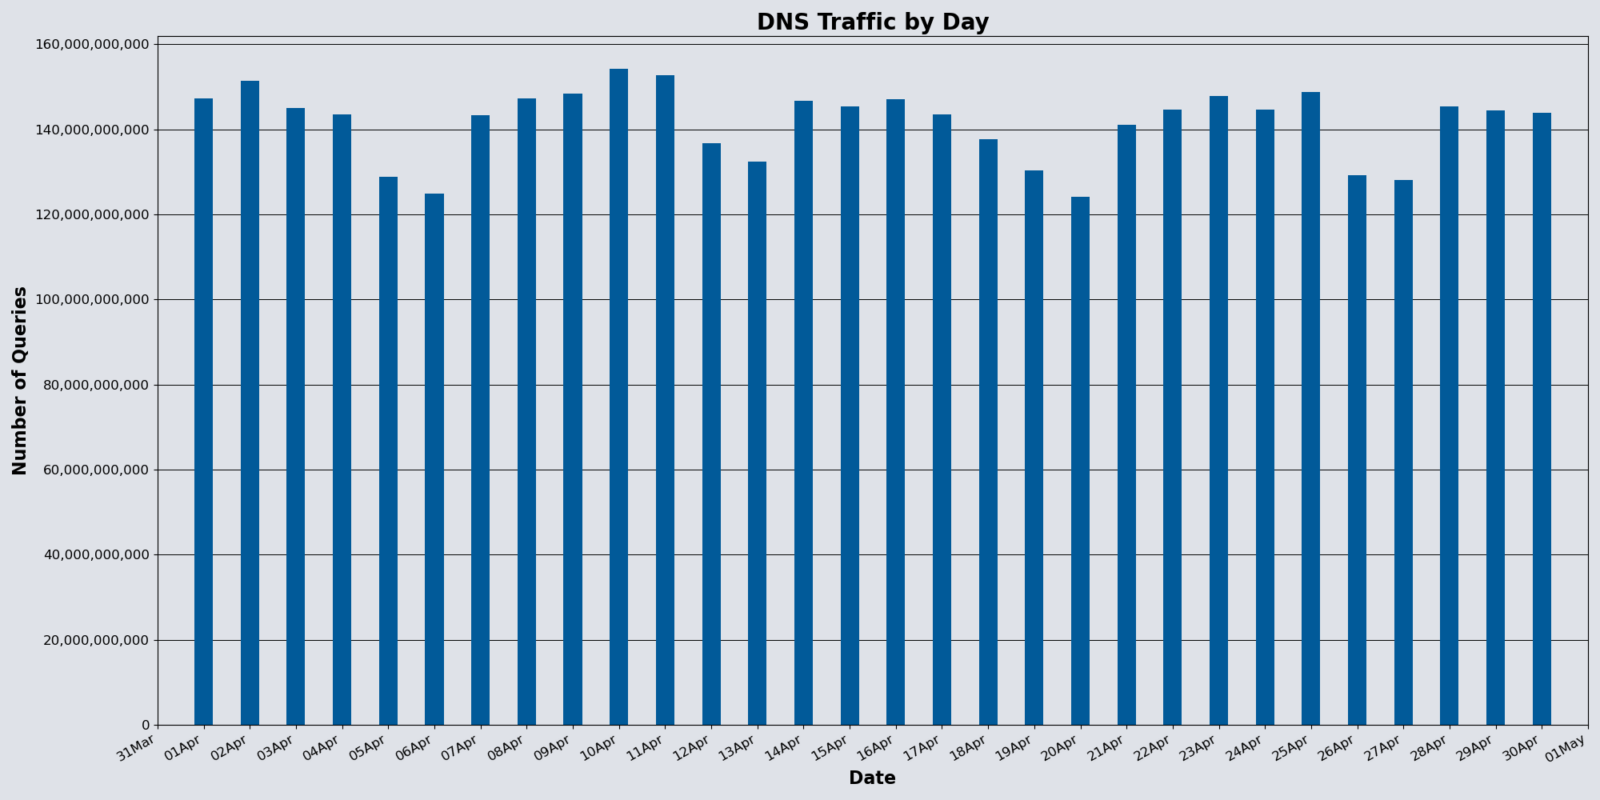
Vercara Managed DNS noted a slight decrease in overall web traffic for April, with total authoritative DNS queries surpassing 4.24 trillion, likely because the month is one day shorter. Vercara’s UltraDNS mitigated 149 DDoS attacks targeted against the platform in April, an alarming 396.67% increase from March.
Notably, the Next Secure (NSEC) record type experienced an astonishing 231.26% month-over-month increase. While this record helps validate non-existent domain queries and helps mitigate DNS-based attacks, malicious actors can use zone enumeration to identify DNS zone structures if the NSEC3 is not properly obscured. This contrast highlights the delicate balance between improving transparency and protecting DNS infrastructure from reconnaissance and abuse.
For more details, check out the DNS Analysis report, which is published monthly.
IPv4 and IPv6 Trends
Overall, April followed in March’s footsteps with the Top 3 DNS Query types:
- A Record
- AAAA record (quad-A)
- Name Server (NS)
The consistent percentage of quad-A record queries indicates a continued shift toward IPv6 and its additional security benefits.
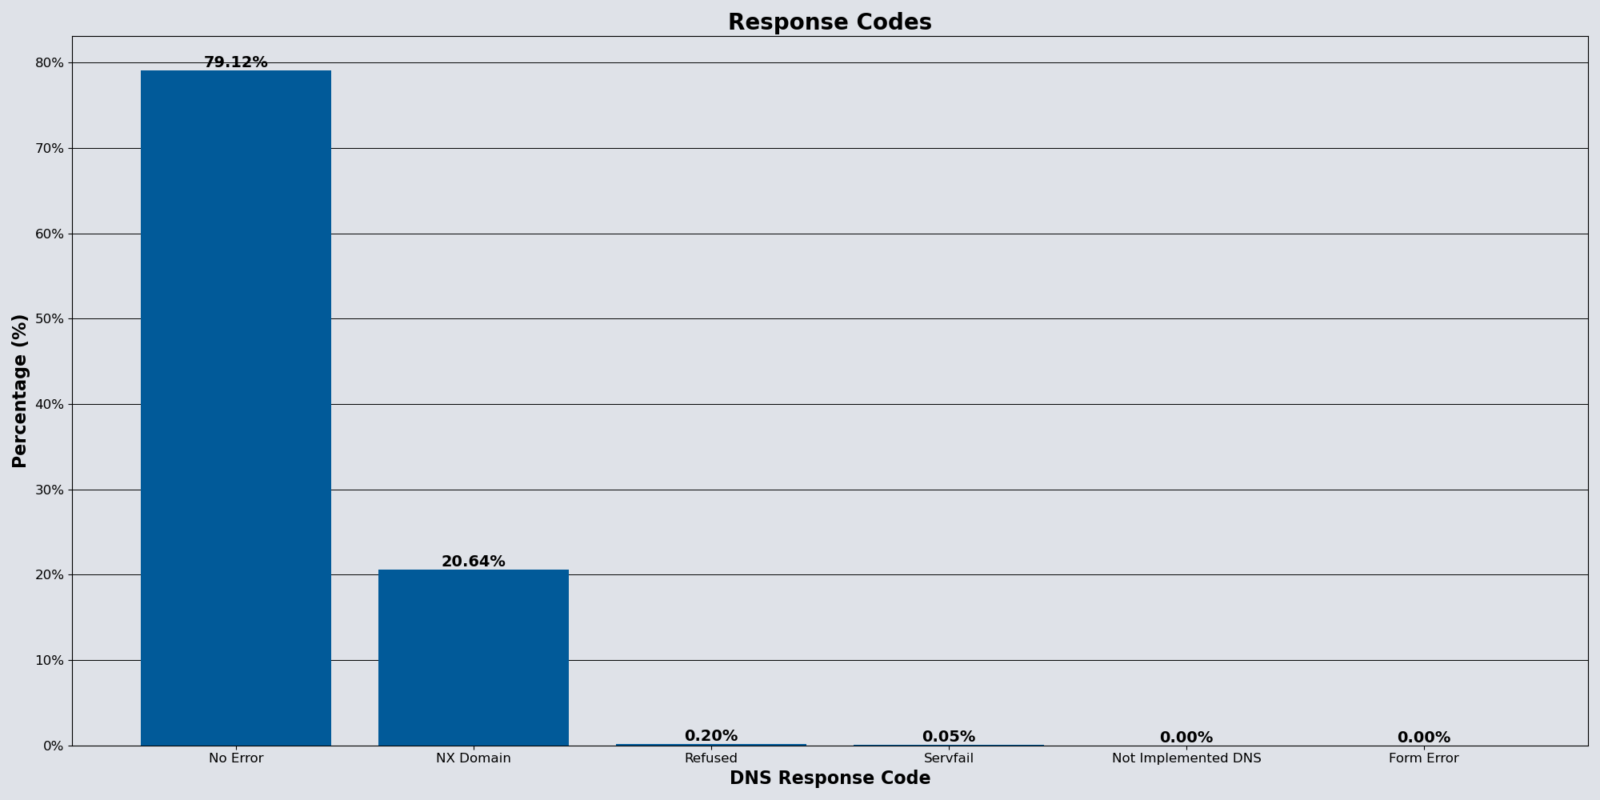
DNS Response Codes Remain Stable
The top two response codes remained the same month-over-month:
- “No Error”: most prevalent response code at 79.11%, a 3.00% month-over-month increase
- “NXDomain”: 20.64%, a 9.36% month-over-month decrease
The NX Domain response code can indicate a misconfiguration or attackers using DNS enumeration tools that can cause a DDoS attack.
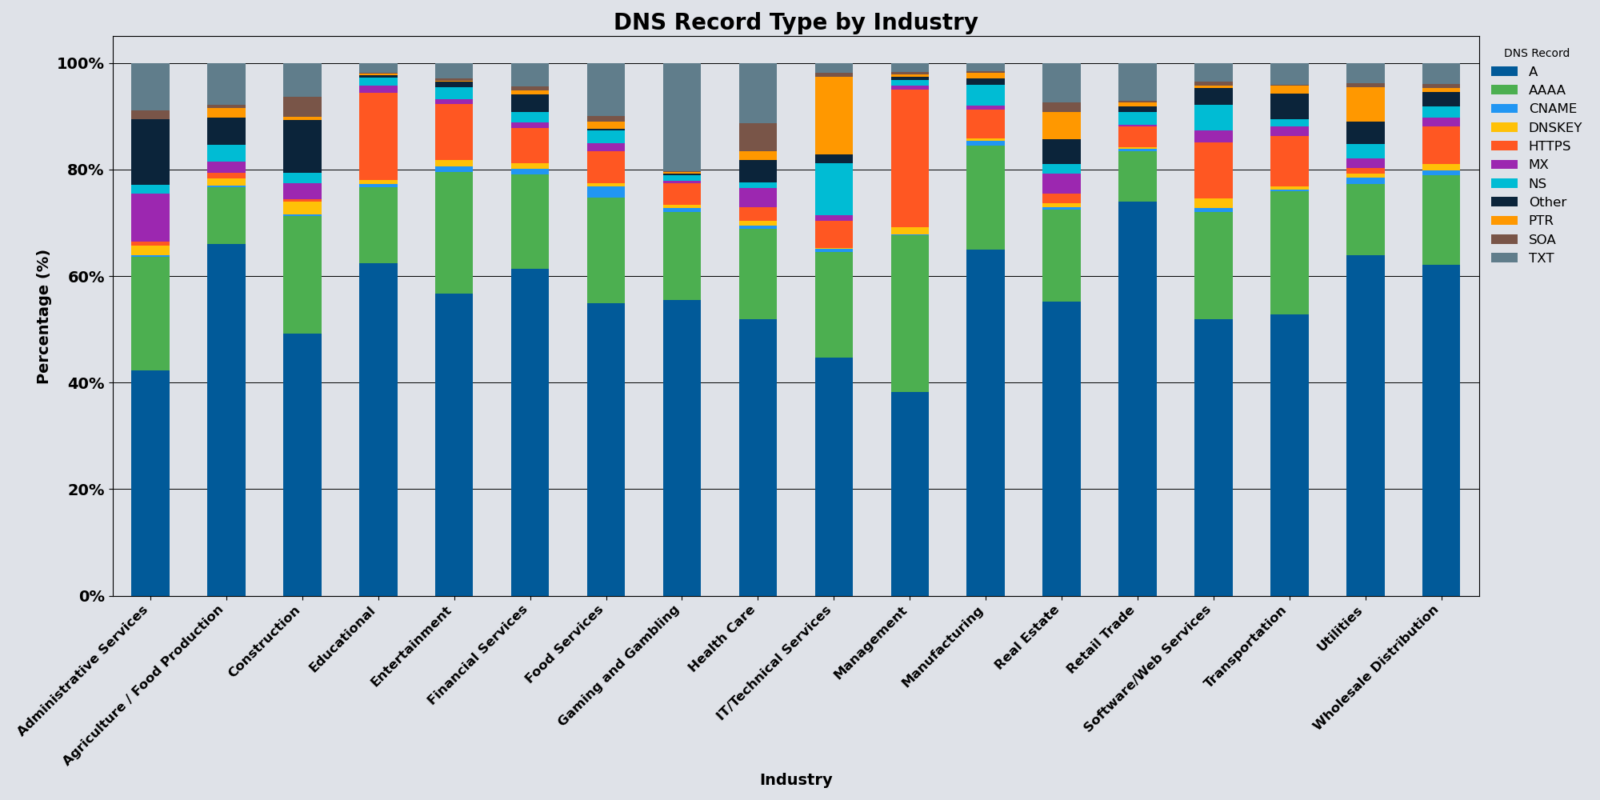
Industry Sectors
Industry sectors continue to work on and improve their DNS management, with April’s report showing both wins and areas for improvement.
The DNS record type queries provide insight into how the industry uses digital infrastructure. Some highlights include:
- Widespread requests for HTTPS records indicate emphasis on secure web communications.
- Financial Services and Health Care verticals show a moderate presence of TXT records, indicating a heightened emphasis on email authentication protocols like SPF or DKIM.
Administrative Services and Construction
These two industries continue to see the NX Domain response code being the most prominent response code returned, possibly arising from:
- Misconfigurations
- Use of DNS enumeration tools
- Certain types of DDoS attacks, like DNS water torture attacks
Web Application Firewall (WAF): More Requests and New Threats
During April, Vercara UltraWAF received over 1.69 billion web requests, a 30.70% decrease compared to March, but malicious activity continued to increase. WAF violations increased by 20.78%. The sharp increase in violations despite reduced overall traffic suggests heightened targeting of specific services or industries.
The XML_WSI_ERR_BODY_ENV_NAMESPACE category showed a significant 15,020% increase, indicating exploitation attempts targeting SOAP-based services through malformed or namespace-confused XML payloads. Malicious actors often use this evasion technique to bypass XML parsers and exploit vulnerabilities in web services.
Attackers continue to rely on a mix of both sophisticated and basic tactics to probe and exploit web services, as evidenced by the following traditional attack categories that remained prevalent:
- Invalid RFC: 30.34%
- Command Injection: 20.71%
For more details, check out the WAF Analysis report, which is published monthly.
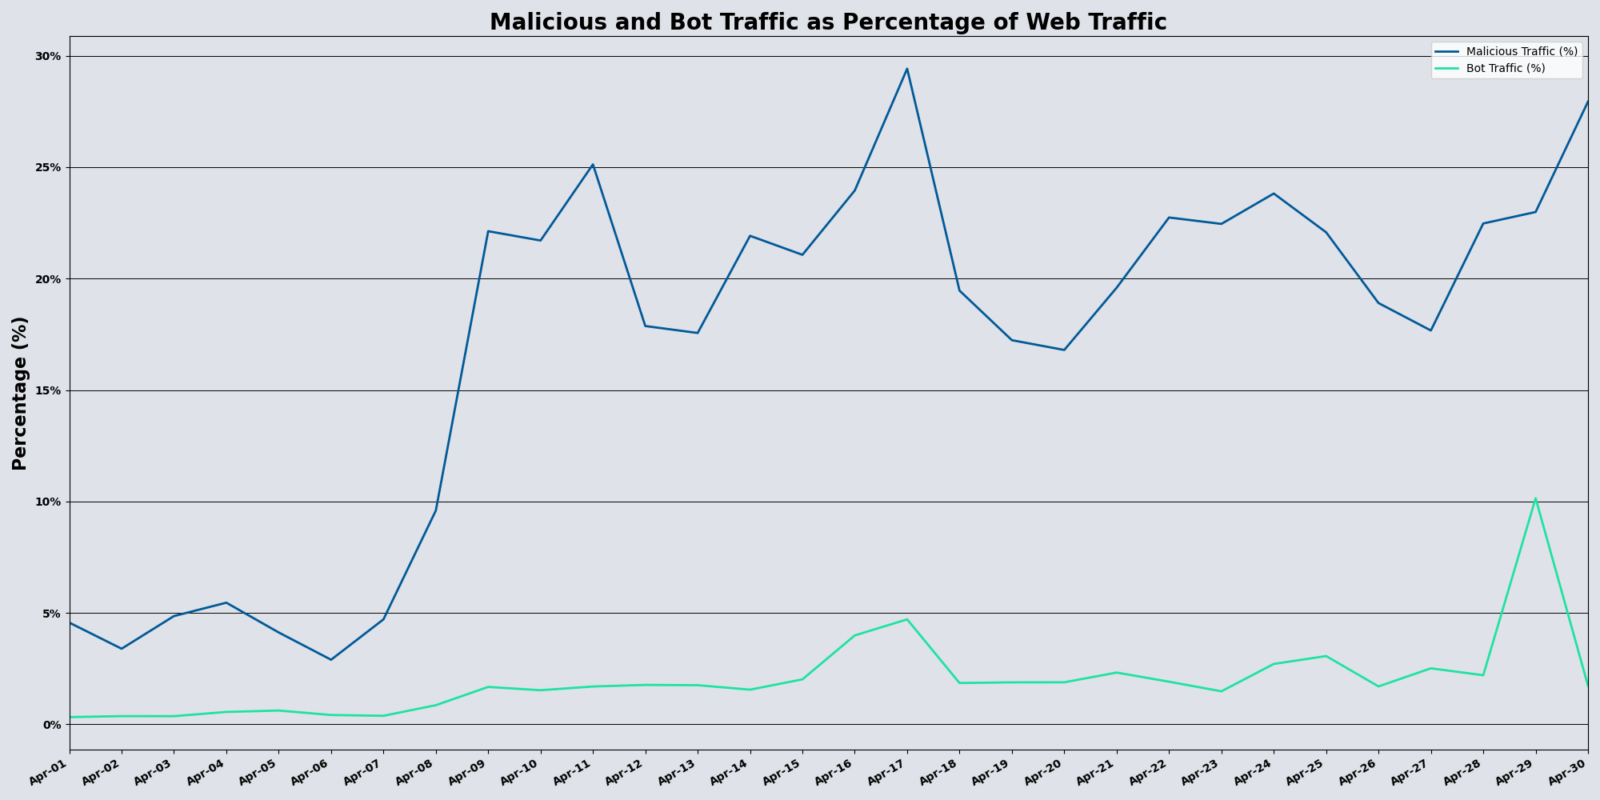
Increased Activity
April’s data found:
- 20.78% increase in malicious activity compared to March
- 26.81% increase in the amount of bot traffic compared to March
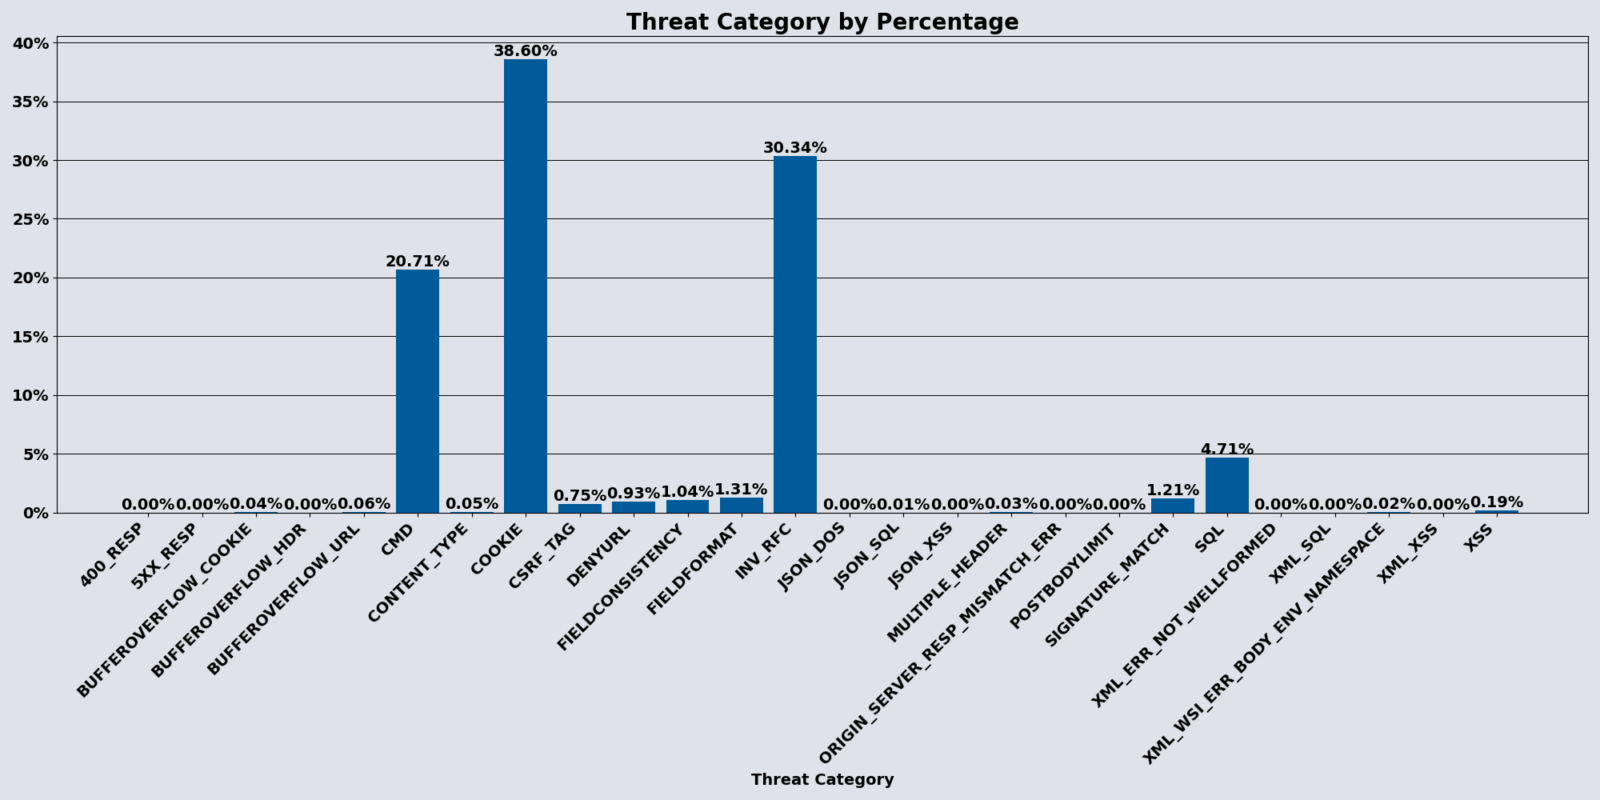
Top 3 Threat Categories
Along with these overall increases, April showed additional changes:
- Cookie threat category remained most prevalent, accounting for 38.60% of malicious traffic
- Invalid RFC threat came in second, accounting for 30.34% of malicious traffic
- Command Injection came in third, accounting for 20.71% of malicious traffic
April Countermeasure Of The Month
Our featured countermeasure this month is the WAF bypass feature built into the network controls tab that UltraWAF administrators can use to configure IP addresses that will bypass WAF and other controls in that policy. This feature helps reduce false positives from activities like posting new HTML content or modifying javascript libraries inside of a Content Management System.
By adding an IP address or CIDR block and setting the “Not Blocked” option, that IP address will bypass all the controls inside of the WAF policy, including:
- WAF Countermeasures
- WAF Signatures
- Bot Countermeasures
- Bot Signatures
- Rate Controls
- Responder Policies
- Geoblocking
Turnkey Cloud-based Security with Vercara
Vercara provides a turnkey, multilayered approach to security with UltraDNS, UltraDDoS Protect, and UltraWAF. With Vercara’s comprehensive suite of solutions, organizations gain advanced security capabilities, insights for informed decision-making, and improved resilience against cyber threats.
To learn how Vercara’s suite of solutions can help defend your organization, contact our sales team.